UniCon 2020 CTF Challenge
**UPDATE** This entry ended up winning the first-place grand prize as announced by Scythe. Check out the other excellent winners here. Many thanks to Scythe for providing such great content to the community.
Introduction
UniCon 2020 included an excellent NetWars-style CTF that involved executing payloads and observing behaviour. Spanning three levels, the exercise provided a breadth of insight into malicious payload execution and how to go about analyzing the activity using tools such as Sysmon and Wireshark. The optional take-away challenge was to further examine the ‘level3.exe’ payload and submit a report on the findings.
Lab Setup
A Windows 10 virtual machine was used with SysInternals Sysmon and Procmon installed, as well as Wireshark. The VM had the hostname set to 'SANS-SIFT' with username 'SANSDFIR'.
Sysmon and Wireshark are the primary tools needed, but Procmon can be of great help to visualize process activity. Windows Event Logs contain a wealth of information. Turning on process and command-line auditing provides process execution information and the command-line arguments used at the time of process start (EID 4688 in Security.evtx). Sysmon records this and much more (network connections, file and registry modifications) and logs to Microsft-Windows-Sysmon%4Operational.evtx. Additional tools and commands are mentioned as well; however, they were largely used to validate data and to present it in a friendlier format.
Findings – Host
Let’s first take a look at the metadata of the ‘level3.exe’ payload that we are investigating using ‘exiftool’, the ‘file’ command, and generating hash values:
| Name: | level3.exe |
|---|---|
| Size: | 329216 bytes |
| Signed: | No |
| MD5: | 700b64dd134eba64309b5628775cf7af |
| SHA-1: | 7c43c28314bc6dad24664a38ba32997d4114b0db |
| SHA-256: | fd4f25567498032e3f4dd75a211c4729a895abadb5609345b52c469f4d99dc31 |
| Time Stamp (Creation): | 2019:09:09 09:36:00+00:00 |
| File Format: | PE32+ executable (GUI) x86-64, for MS Windows |
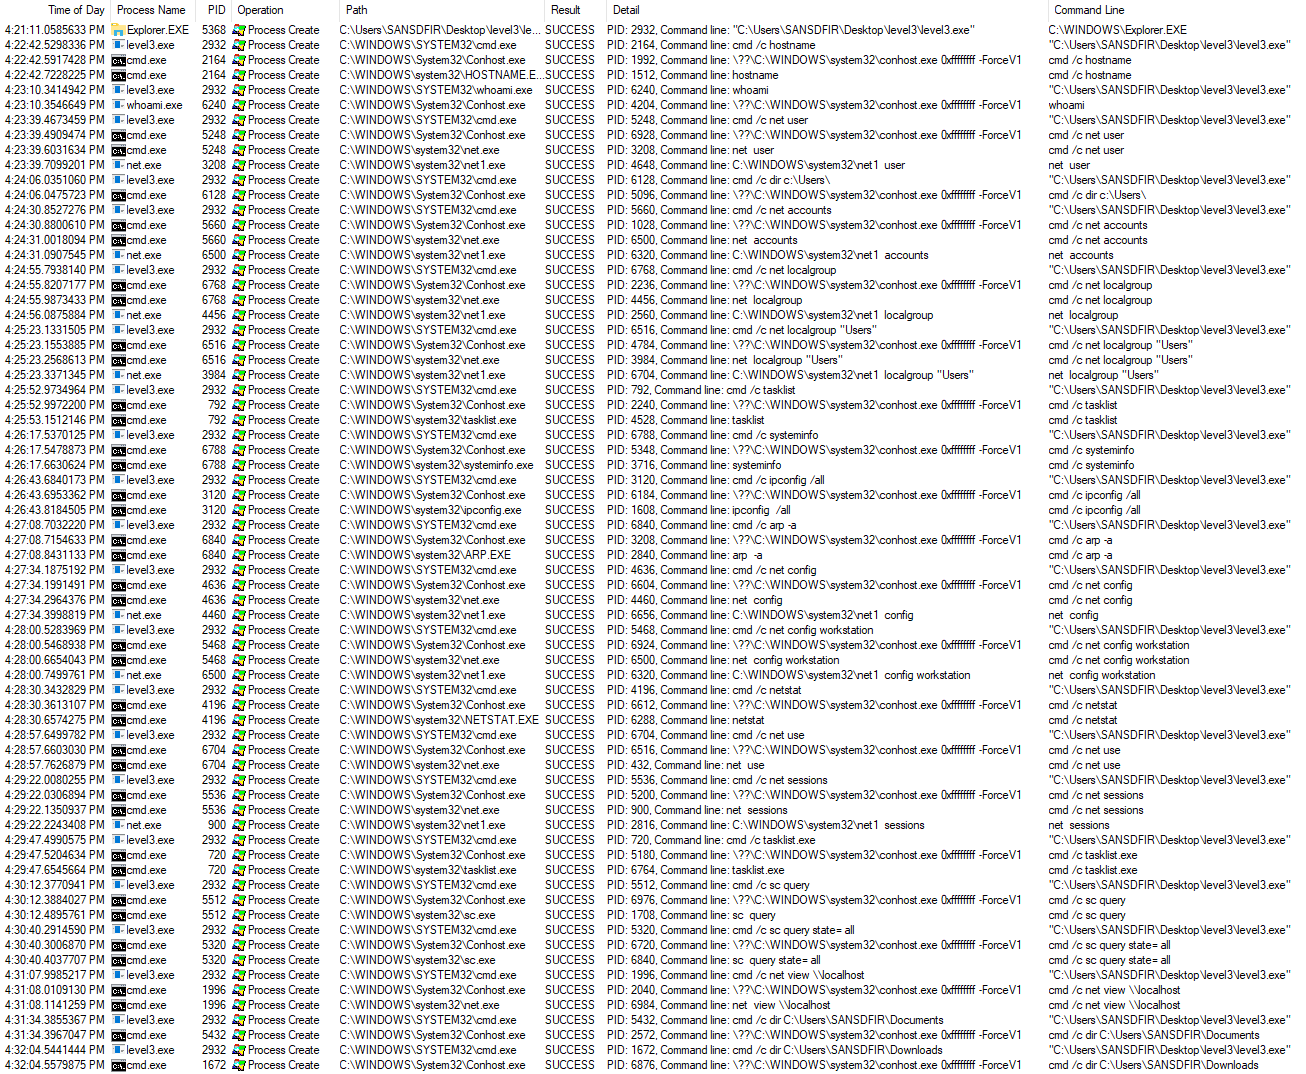
The next step is to install and start our tools. Upon install, Sysmon will be running in the background. Wireshark and Procmon will need to start capturing just before payload execution. Once ready, we begin capture and observe the results. Starting with Procmon, there will be an overwhelming number of events which we can filter out except for those of interest. We know the Process Name is ‘level3.exe’ which can be further filtered for the ‘Process Create’ Operation:
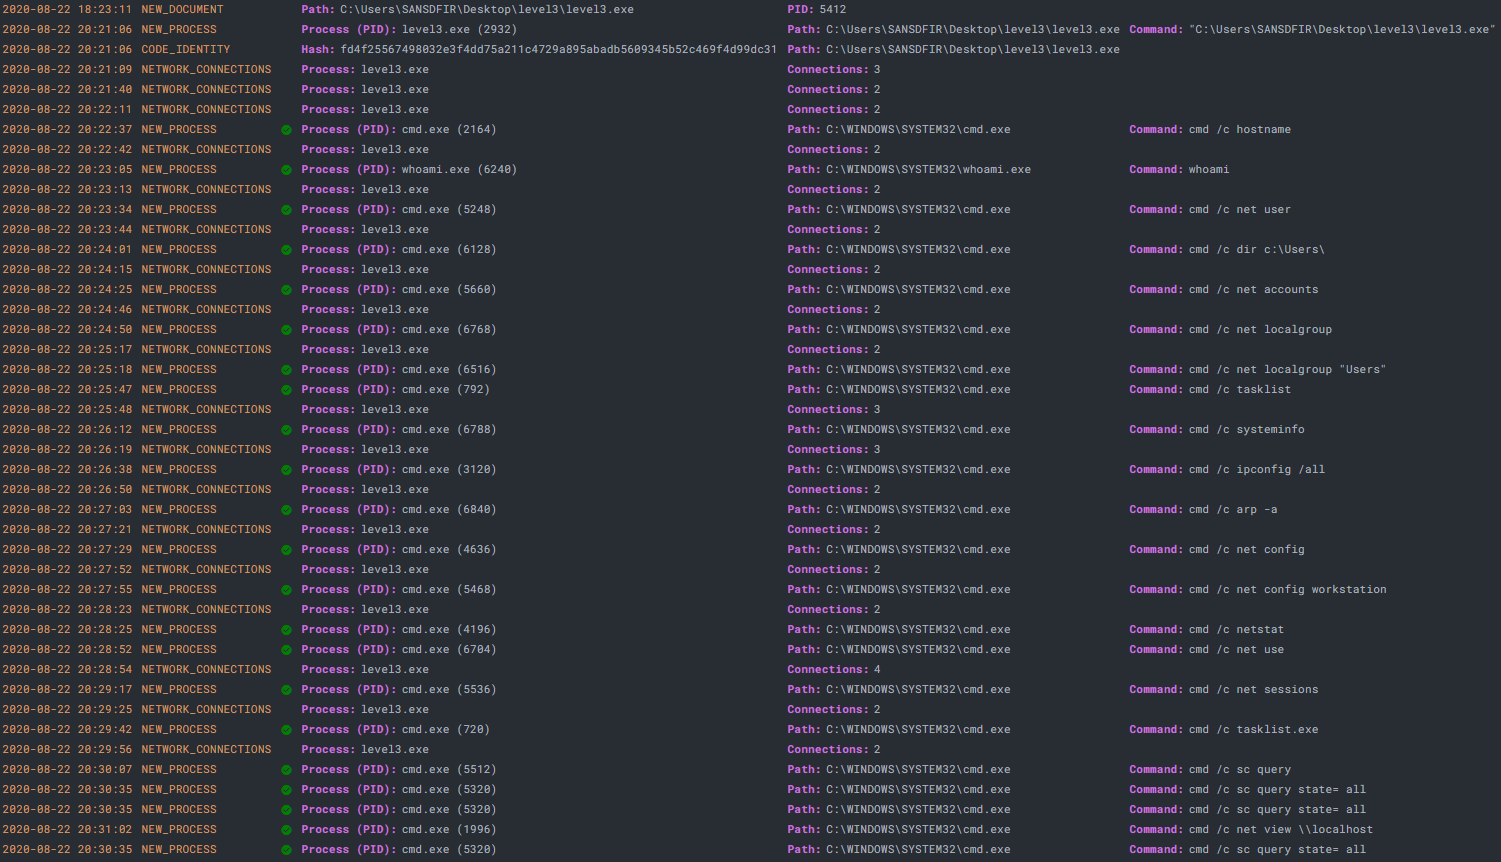
22 events are returned that show copious usage of the Windows Command Prompt (cmd.exe) to query various system and user properties. Note the ‘/c’ switch carries out the command specified by string and then terminates:
| Command Line | Description |
|---|---|
| cmd /c hostname | Display the system hostname. |
| whoami | Display the domain and user name of the current user. |
| cmd /c net user | Display a list of all user accounts for the local computer. |
| cmd /c dir c:\Users\ | Display the volume label/serial number and a list of files and subfolders in 'Users' folder. |
| cmd /c net accounts | Display the current password and logon restrictions for the computer and computer role (Server or Workstation). |
| cmd /c net localgroup | Display the name of the system and the names of local groups on the computer. |
| cmd /c net localgroup "Users" | Display the members of local group 'Users'. |
| cmd /c tasklist | Displays a list of currently running processes and services on the system. |
| cmd /c systeminfo | Displays detailed configuration information about the system, including operating system configuration, security information, product ID, and hardware properties. |
| cmd /c ipconfig /all | Displays the full TCP/IP configuration for all physical and logical network adapters. |
| cmd /c arp -a | Display current ARP cache tables for all interfaces. |
| cmd /c net config | Display information about the configuration of the Server or Workstation service. |
| cmd /c net config workstation | Display Workstation service and host information such as computer name, logon and workstation domain, username, and operating system version. |
| cmd /c netstat | Display active TCP connections. |
| cmd /c net use | Display a list of connections with detailed information about currently mapped network resources. |
| cmd /c net sessions | Displays information about all sessions with the local computer, such as computer name, username, client type, and idle time. |
| cmd /c tasklist.exe | Displays a list of currently running processes and services on the system. |
| cmd /c sc query | Display information for active services only. |
| cmd /c sc query state= all | Display information for all services (active and inactive). |
| cmd /c net view \\localhost | Display a list the file/printer shares on the local computer. |
| cmd /c dir C:\Users\SANSDFIR\Documents | Display the volume label/serial number and a list of files and subfolders in 'Documents' folder.* |
| cmd /c dir C:\Users\SANSDFIR\Downloads | Display the volume label/serial number and a list of files and subfolders in 'Downloads' folder.* |
*Directory listings for username (SANSDFIR) replicated by substituting %USERNAME% (cmd /c dir C:\Users\%USERNAME%\Downloads || cmd /c dir C:\Users\%USERNAME%\Documents)
We see extensive system and user fingerprinting and profiling before the program exits. These are common discovery tactics which evade defenses by ‘Living off the Land’, utilized by malware and advanced threat actors for purposes including privilege escalation and lateral movement. Aside from the initial payload, no foreign programs are introduced to the system, instead using Windows built-ins native to the operating system (also known as ‘LOLBins’) which are visible by removing the Process Name filter:
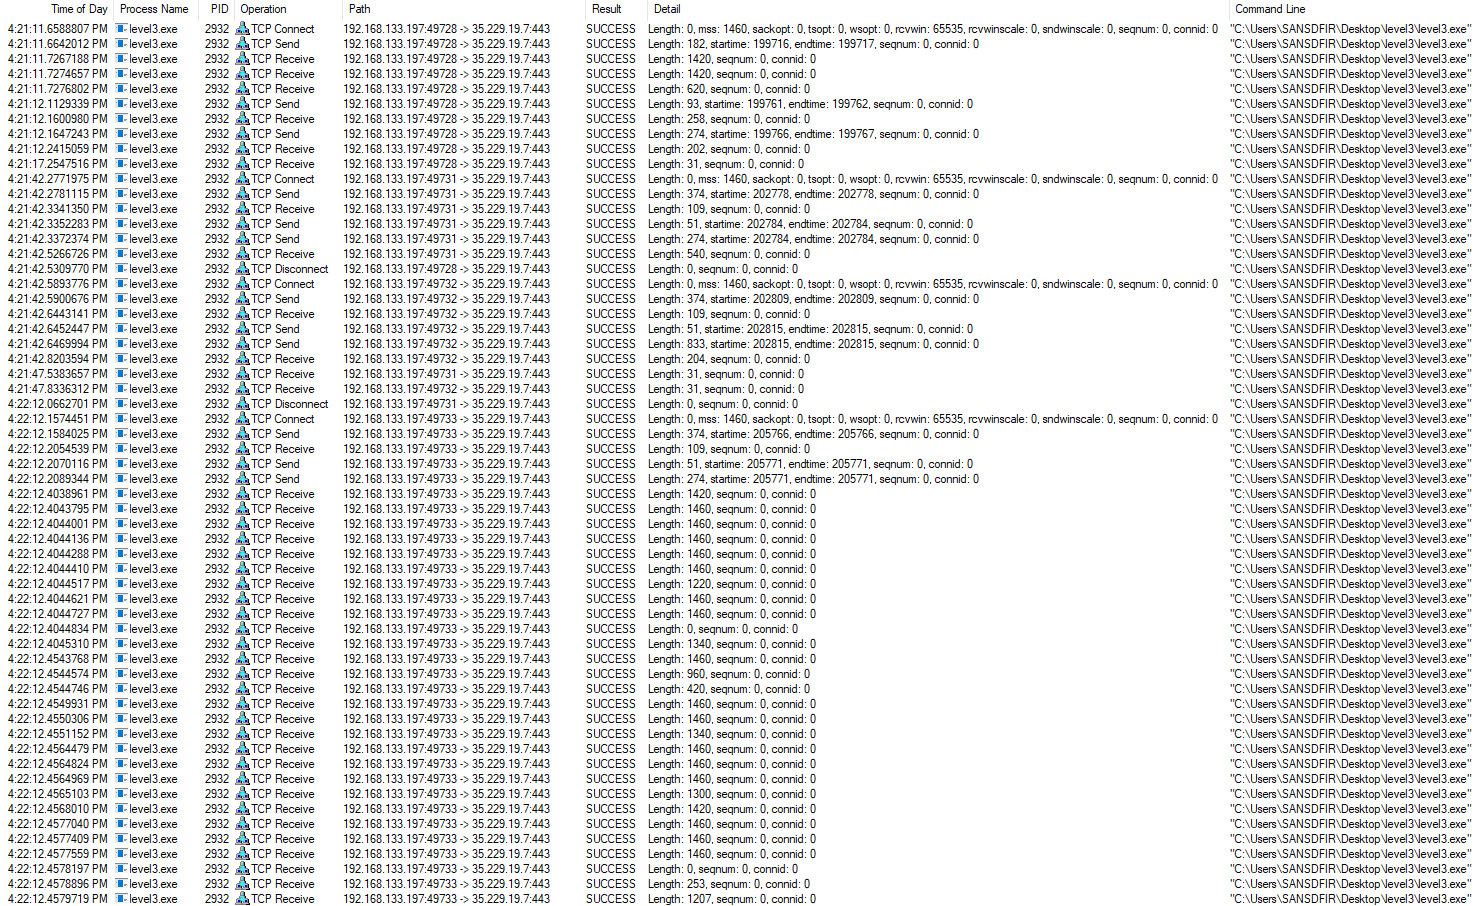
Changing the Operation filter to contain ‘TCP’ and the Command Line to contain ‘level3.exe’, network connections are visible during execution. There are numerous connections for two IP addresses, one of which is the Command-and-Control:
ocsp[.]int-x3[.]letsencrypt[.]org – port 80
madrid[.]scythedemo[.]com - 35.229(.)19.7 – port 443 – C2
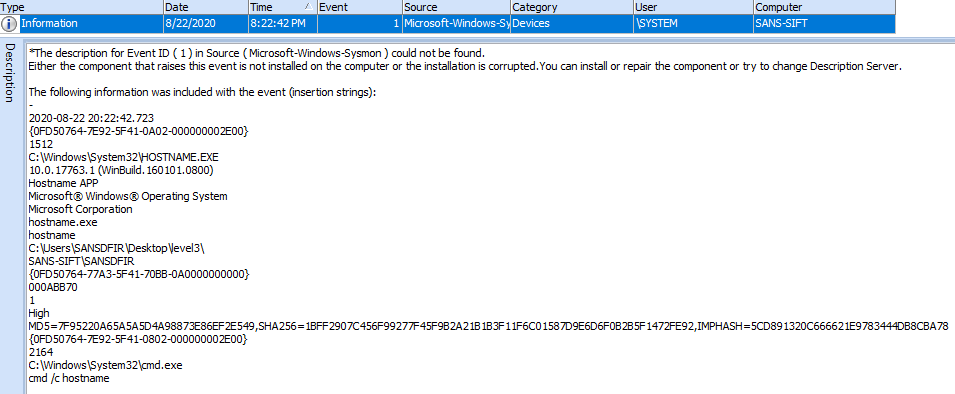
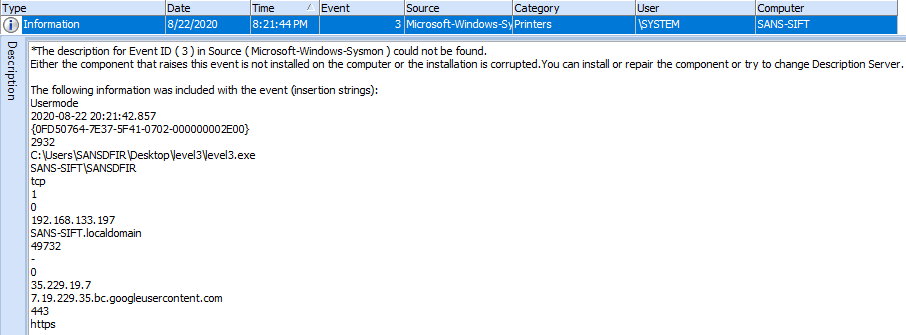
Before proceeding to the network portion, let’s take a look at a few other data sources. Sysmon logged the same information and can be viewed using the Windows Event Viewer or Event Log Explorer by filtering for the following Sysmon event IDs:
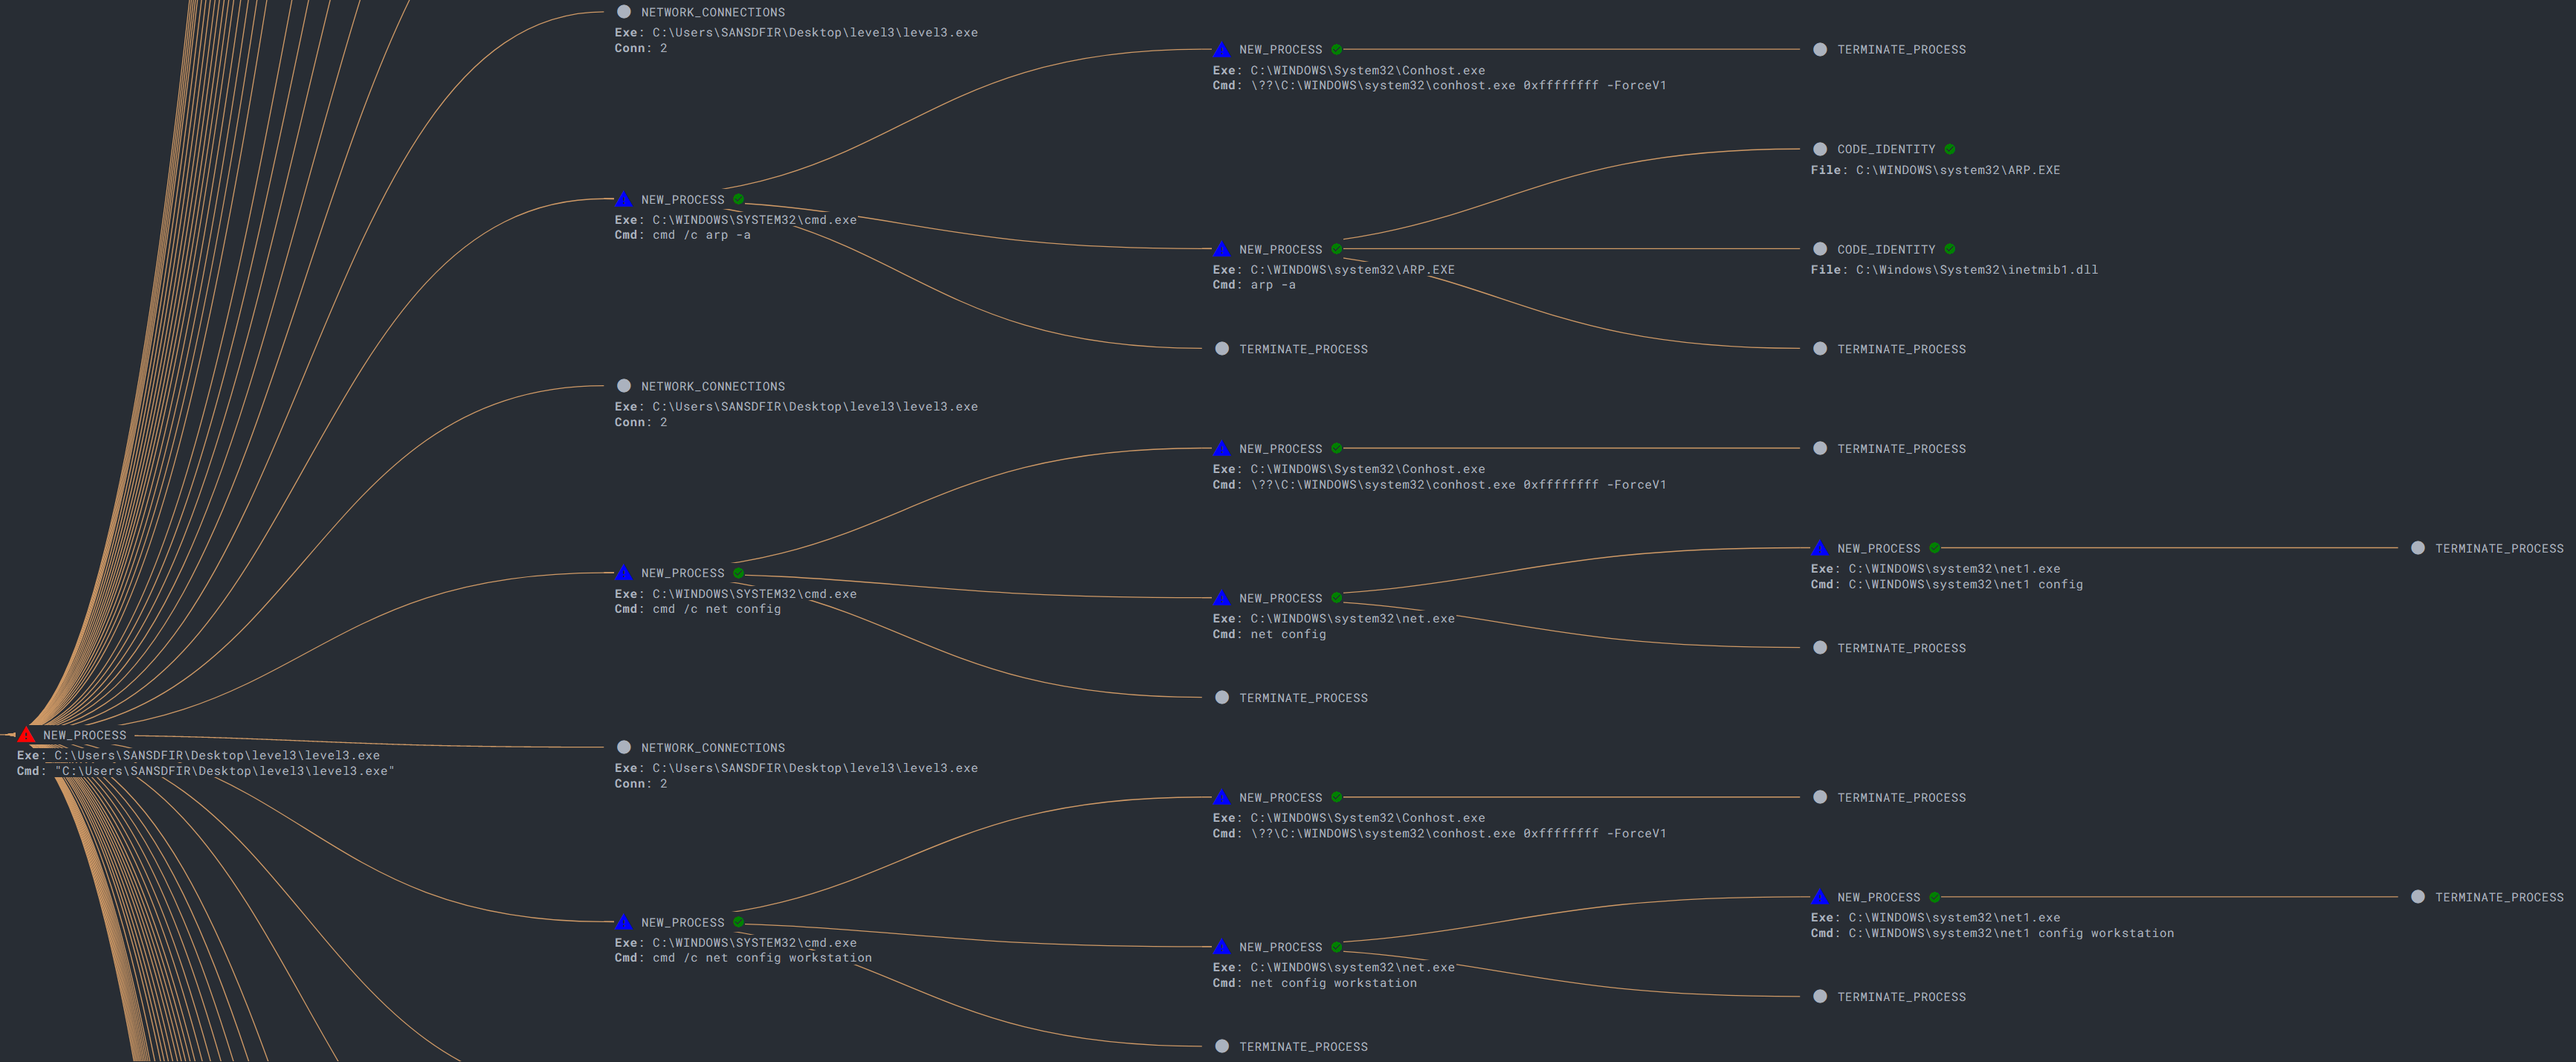
As a bonus, if you have access to an EDR, a process tree graph is handy for visualization (and was massive for this sample):
Windows Prefetch files are extremely valuable here and can be parsed using PECMD to determine last run times and counts. We see grouped runs of the Windows binaries relative to the 'level3.exe' payload - perfect for checking any additional binaries that may have been dropped and executed:
| Executable Name | Last Run |
|---|---|
| LEVEL3.EXE | 8/22/2020 20:21:11 |
| HOSTNAME.EXE | 8/22/2020 20:22:42 |
| WHOAMI.EXE | 8/22/2020 20:23:10 |
| SYSTEMINFO.EXE | 8/22/2020 20:26:17 |
| ARP.EXE | 8/22/2020 20:27:08 |
| NETSTAT.EXE | 8/22/2020 20:28:30 |
| NET1.EXE | 8/22/2020 20:29:22 |
| TASKLIST.EXE | 8/22/2020 20:29:47 |
| SC.EXE | 8/22/2020 20:30:40 |
| NET.EXE | 8/22/2020 20:31:08 |
| CONHOST.EXE | 8/22/2020 20:46:32 |
| CMD.EXE | 8/22/2020 20:46:32 |
| IPCONFIG.EXE | 8/22/2020 21:27:13 |
Lastly for usage, the System Resource Usage Monitor database can be parsed using SRUM-DUMP to give us application usage statistics. Network data such as bytes sent/received are recorded which we can use to determine payload data exfiltration and lateral movement:
| Application | Bytes Sent | Bytes Received |
|---|---|---|
| \device\harddiskvolume1\users\sansdfir\desktop\level3\level3.exe | 285090 | 192926 |
Findings – Network
From the endpoint analysis, the C2 domain and IP address were identified thanks to numerous beacons:
madrid[.]scythedemo[.]com - 35.229(.)19.7 – port 443 – C2
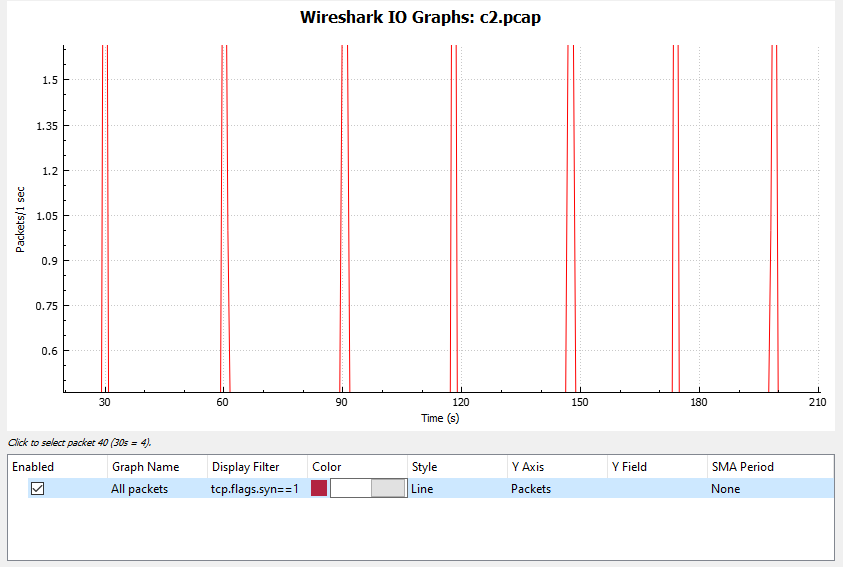
By applying a filter for the IP address in Wireshark and filtering for SYN request packets, we see regular callbacks approximately ~30 seconds apart using the I/O graph with a ~15% jitter interval. This can also be calculated by eyeballing the time difference between SYN packets:
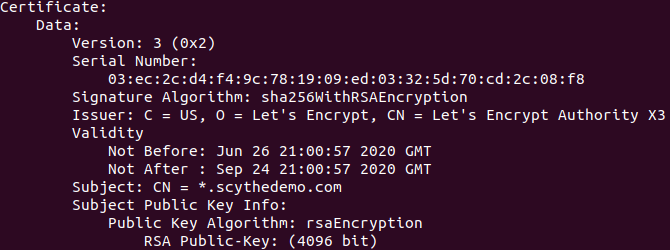
Analysis of the traffic content is difficult due to encryption, but we can still obtain data. Using Wireshark, the C2 TLS certificate can be carved by exporting HTTP objects and viewed using ‘certutil’ or ‘openssl’. We see the issue as Let’s Encrypt and the subject (scythedemo) matching the C2 FQDN:
| Name: | scythedemo.com.cer |
|---|---|
| Size: | 1628 bytes |
| MD5: | c7222a647706d3a52c1ae28a28f40fa0 |
| SHA-1: | 6c64e8185418d0e6416dbaf36b5a01ded23ac968 |
| SHA-256: | 8737e4ae09ad4cd9e2ac19f9d0420569d3390600a9e3c2d5a9aa21c97f9945fa |
We can also extract JA3 signatures for TLS fingerprinting. The JA3 algorithm takes a number of settings from the ‘Client Hello’ of a TLS handshake and concatenates to a string which is MD5 hashed, producing an easily-consumable fingerprint. These can be extract from a PCAP in Wireshark by using this JA3 plugin:
| JA3 Digest: | a0e9f5d64349fb13191bc781f81f42e1 |
|---|---|
| JA3 Fingerprint: | 771,49196-49195-49200-49199-49188-49187-49192-49191-49162-49161-49172-49171-157-156-61-60-53-47-10,0-5-10-11-13-35-23-65281,29-23-24,0 |
The JA3 digest for the encrypted C2 traffic (a0e9f5d64349fb13191bc781f81f42e1) can then be searched through a JA3 repository on JA3er. This hash has been reported previously as ‘Windows 10 socket initiating a TLS communication when going to a domain’ which makes sense. However, if we do a few internet searches we see it come up in a variety of malware reports – notably associated with Metasploit Meterpreter, which leads in nicely to the CTI section.
Cyber Threat Intelligence
Since we analyzed the behaviour of the ‘level3.exe’ payload and obtained an exhaustive list of indicators, it made sense to try and map them to TTPs to find a potential threat actor profile. The majority were software based, so MITRE’s ATT&CK software entries were searched for threat groups tied to ‘net’, ‘tasklist’, ‘systeminfo’, ‘ifconfig’, ‘arp’, and ‘netstat’ commands. There are also callbacks to the C2 through encrypted channels (Web Protocols, Fallback Channels). A threat group consistently observed in each category was ‘OrangeWorm’.
OrangeWorm was identified by Symantec in 2015 targeting global supply-chains within large corporations, namely in the healthcare sector. The group was observed installing backdoor Trojan ‘Kwampirs’ to carry out attacks. Looking at Symantec’s analysis and MITRE’s ATT&CK entry, characteristics of the ‘level3.exe’ payload paint a clear picture:
TTPs and indicators used by OrangeWorm located on Scythe’s GitHub repository match almost perfectly using the ATT&CK Navigator:
Having mapped the payload and threat actor, we can use these TTPs and indicators to hunt for threats in the environment.
Thank you again to Scythe for hosting such a great event. Check them out at Scythe.io.

